

How to Interpret Marketing Metrics Without Owning the Dashboard
Picture a software company launching a free trial. You’re in charge of developing the end-to-end campaign, bringing the strategy to life across the landing page, advertising creative, onboarding emails and a webinar. Every element launches on time.
Once the campaign is live, ownership naturally separates. Paid media monitors acquisition, sales evaluates lead quality, product teams track adoption, and the people who shaped the campaign may receive only part of the resulting picture.
My work has often sat between strategy and execution, spanning positioning, messaging, landing pages, paid-media creative and lifecycle campaigns across the customer journey. That vantage point has shown me how easily performance reporting can become separated from the thinking that shaped the campaign to begin with.
But the challenge isn’t actually gaining access to every single dashboard. It’s maintaining enough visibility to understand which assumptions held, where audience behaviour changed and what the next campaign should carry forward.
Marketing judgment comes from reading metrics as a connected system, separating observation from assumption and identifying the evidence needed to make the next decision. That begins by reconstructing the customer journey behind reports that may be divided across platforms and teams.
The Benefits of Reading Performance Metrics Across the Customer Journey
In the software trial campaign, an ad impression may lead to a site visit, trial registration, qualification, product adoption, paid conversion and revenue. Each performance metric measures movement between particular stages of that journey.
Clickthrough rate shows how frequently impressions produce visits. Landing-page conversion shows how frequently those visits produce trial signups. Qualification and customer-conversion rates reveal whether the people entering the campaign continue towards its intended business outcome.
Following those transitions together changes what the analysis can reveal. Rather than treating each result as an independent score, we can locate where performance shifted, compare acquisition efficiency with downstream quality, connect early response to the campaign objective and create shared understanding across teams. Here are four practical benefits for interpreting campaign performance.
1. A Clearer View of Where Performance Changed
Connected metrics make it easier to identify the stage at which results began to change.
If an ad generates a high clickthrough rate but the landing page converts poorly, the decline occurs between the click and registration. If trial volume is healthy but few users become customers, the point of concern appears further along the journey.
This narrows the investigation without prematurely assigning the cause to a particular message, channel or experience.
2. A More Complete Picture of Campaign Efficiency
A campaign that appears efficient at one stage may look different when the quality and value of its results are considered.
One campaign may generate more leads at a lower cost, while another produces fewer but more qualified prospects. Cost per lead favours the first campaign, but cost per qualified lead may favour the second.
Both results can be accurate. Reading them together provides a more complete picture of which campaign used its budget effectively.
3. Greater Alignment Between Early Results and Campaign Goals
Early indicators are useful, but they do not necessarily confirm that a campaign achieved its larger objective.
A strong clickthrough rate, low cost per lead or healthy signup volume can represent success at one stage. If the objective is to acquire suitable customers and generate revenue, the analysis must continue beyond those initial conversions.
Following the results across the journey shows whether early engagement contributed to the outcome the campaign was designed to support.
4. Better Learning Across Teams
A journey-wide view provides a shared reference point when campaign reporting is divided among different teams.
Paid media may report on acquisition, sales may evaluate lead quality, and product teams may track adoption. Each group contributes different evidence about the same customer experience.
Connecting results helps teams understand what the campaign accomplished, where prospects disengaged and which insights should inform the next campaign.
A broader view can identify which part of the customer journey needs attention, but it can’t confirm why the result occurred.
A Five-Question Framework for Interpreting Campaign Results
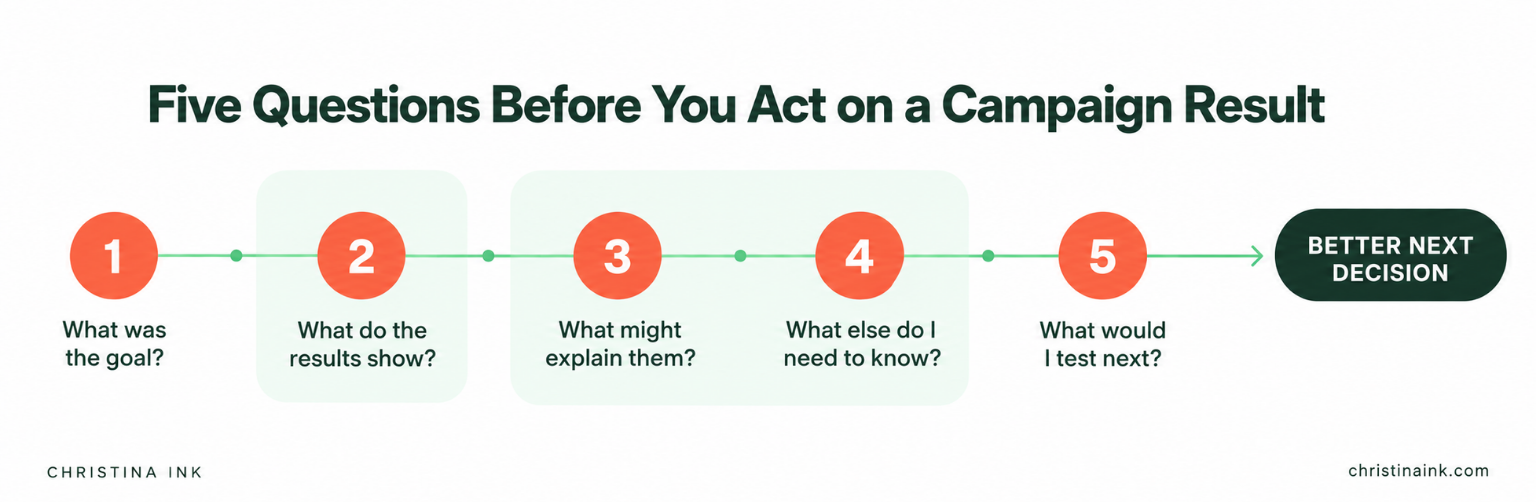
When campaign results are distributed across platforms and teams, the most visible number can easily become the explanation.
A low conversion rate gets blamed on the landing page. Poor lead quality gets blamed on targeting. A strong ROAS is treated as proof that the campaign should receive more budget.
Those interpretations may be reasonable starting hypotheses, but a single metric cannot confirm the cause or justify the decision on its own.
Before diagnosing a result, these five questions can help separate observation from interpretation.
1. What Was the Goal?
Identify the business outcome the campaign was intended to support. The immediate conversion may be a trial signup, content download or webinar registration. The underlying objective could be acquiring qualified prospects who eventually become paying customers.
2. What Do the Results Show?
Record the actual numbers, timeframe and relevant comparison without explaining them yet. “The landing page converted 2% of visitors” is an observation. “The copy failed” is an interpretation.
3. What Might Explain the Results?
Develop one plausible explanation and at least one alternative. A low conversion rate could involve the copy, but it could also involve audience targeting, page usability, offer clarity, tracking or a mismatch between the ad and landing page.
4. What Else Would I Need to Know?
Identify the missing information that could strengthen or change the interpretation. That might include traffic sources, device performance, lead-disqualification reasons, product usage, sales feedback or the amount of time customers typically need to convert.
5. What Would I Test Next?
Recommend a focused change and identify which result would help evaluate it. The goal is to make a change connected to a clear hypothesis and determine what evidence would support or challenge that hypothesis.
These five questions prevent the first plausible explanation from becoming an unsupported conclusion. When important information is unavailable, recognizing that limitation is part of the analysis.
How to Interpret 7 Common Performance Metrics Without Owning the Dashboard
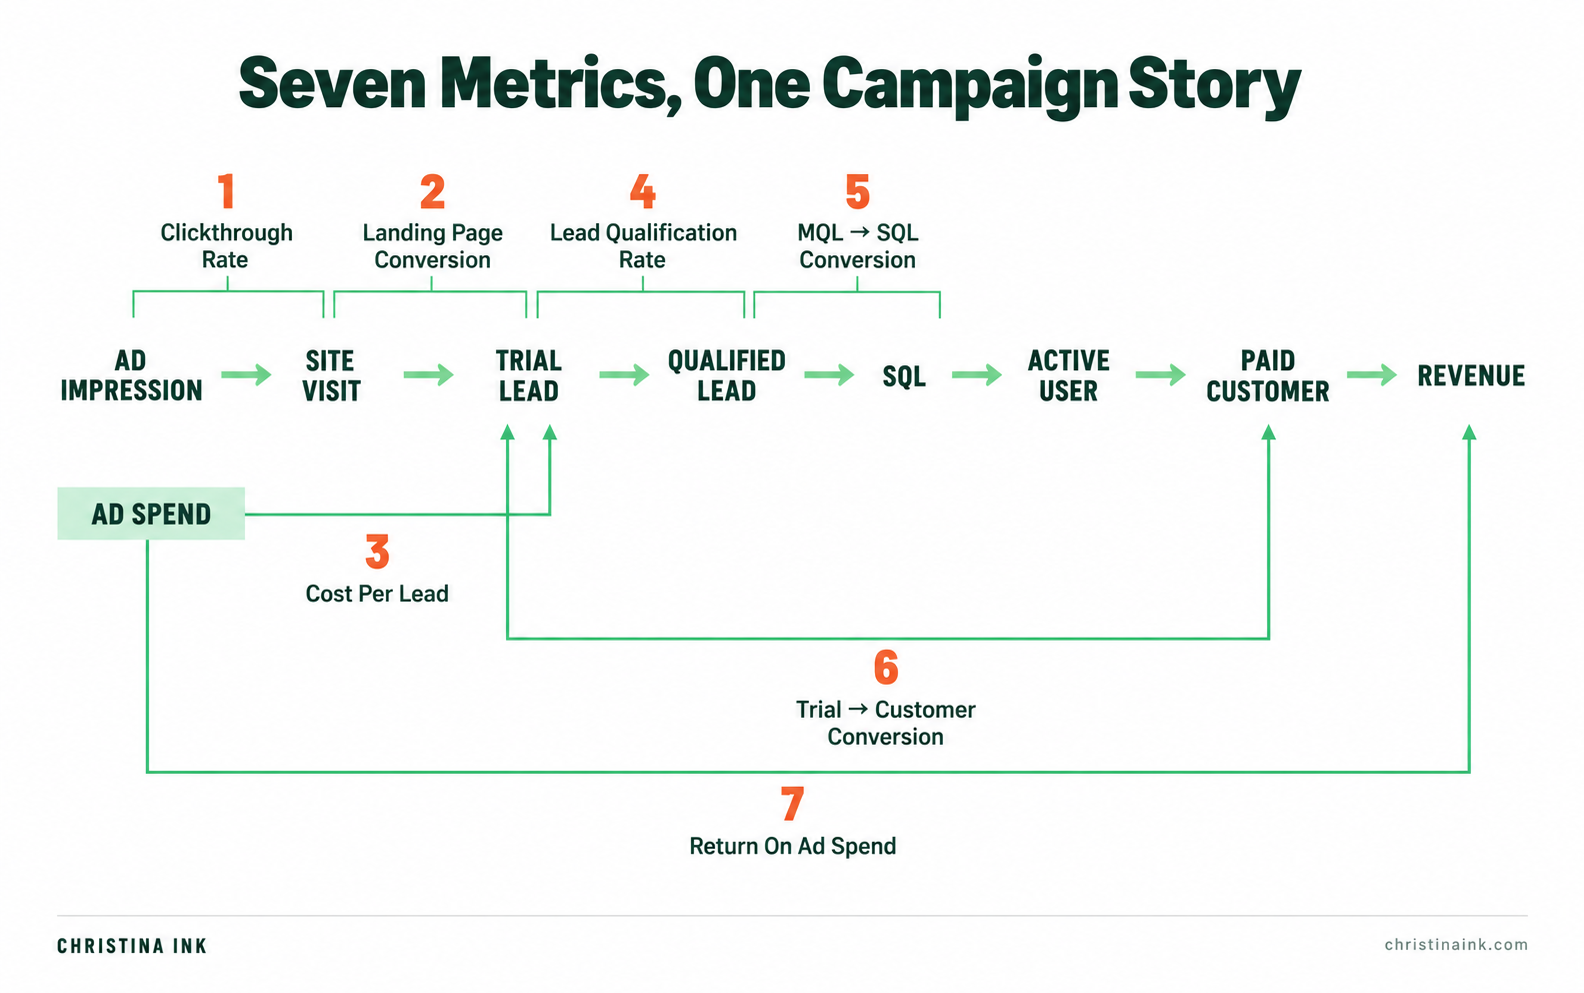
The software trial campaign introduced earlier provides a practical example. Its results may be reported separately across acquisition, qualification, product adoption, paid conversion and revenue. Each result can be accurate while still describing only one part of the campaign’s overall performance.
Interpreting those results does not require direct control of every reporting platform. It requires enough context to understand how each metric relates to the stages before and after it.
The following seven metrics trace the campaign from initial attention through paid conversion. Each example examines what the result confirms, what remains uncertain and which additional evidence could inform the next decision. All numbers are illustrative.
1. Clickthrough Rate
Clickthrough rate (CTR) shows how frequently an ad earns a click after being displayed.
CTR is calculated by dividing ad clicks by impressions and multiplying by 100. An ad shown 10,000 times that receives 200 clicks has a 2% CTR.
In this example, the ad promises to “save hours every week.” That message could attract broad interest, including people who would not benefit from software designed specifically for teams.
A stronger headline might increase CTR, but generating more clicks is not necessarily the right objective. More specific copy could attract fewer clicks while bringing in more suitable prospects. The results after the click determine whether that trade-off improves the campaign.
That relationship between acquisition and downstream performance also shaped the launch and growth of Brushd Beauty, where I worked across Amazon PPC, Google Ads, Meta campaigns and conversion optimization rather than evaluating each channel in isolation.
2. Landing Page Conversion Rate
Landing page conversion rate shows how frequently visitors complete the intended action.
For this campaign, it is trial signups divided by landing page visits, multiplied by 100. Twenty trial signups from 1,000 visits produce a 2% conversion rate.
Now the CTR requires context. If the ad attracts many clicks but few visitors register, the drop occurs between the advertisement and the signup.
The landing page becomes one area to examine, but it is not automatically the cause. I would check whether the page delivers on the ad’s promise, explains the trial clearly and makes registration straightforward across devices. I would also confirm that the tracking works.
A low conversion rate identifies where performance changed. Additional evidence is required to determine whether the problem involves the audience, message, offer, form, user experience or measurement.
The same principle shaped my PaddleSmash conversion work. Because shoppers were unfamiliar with the product, the product detail page first had to explain the game and reduce uncertainty before it could support a purchase decision.
3. Cost Per Lead
Cost per lead shows how much included campaign spending was required to generate each lead.
CPL is calculated by dividing the included campaign cost by the number of leads generated. For this example, only advertising spend is included, and each new trial account is counted as one lead.
| Campaign A | Campaign B | |
| Ad Spend | $1,000 | $1,000 |
| Trial Leads | 50 | 25 |
| Cost Per Lead | $20 | $40 |
Campaign A appears more efficient. It generated twice as many leads and cut CPL in half.
If the reporting ends there, increasing Campaign A’s budget could seem like the obvious next step. Lead volume and CPL, however, do not tell us whether those leads were suitable.
4. Lead Qualification Rate
Lead qualification rate shows how frequently a campaign attracts prospects who meet the team’s agreed criteria and is calculated by dividing qualified leads by total leads and multiplying by 100.
Campaign A generates 50 leads, five of which qualify. Campaign B generates 25 leads, 10 of which qualify. Once qualification is considered, the interpretation changes.
| Campaign A | Campaign B | |
| Ad Spend | $1,000 | $1,000 |
| Total Leads | 50 | 25 |
| Cost Per Lead | $20 | $40 |
| Qualified Leads | 5 | 10 |
| Qualification Rate | 10% | 40% |
| Cost Per Qualified Lead | $200 | $100 |
Campaign A still generates cheaper leads, but Campaign B generates qualified leads for half the cost. The higher CPL did not make Campaign B less efficient once lead quality was considered.
The next question is why Campaign A attracts more people who fail to qualify. Disqualification reasons involving company size, missing features, budget or intended use could reveal a targeting problem, an overly broad promise or an offer that sets the wrong expectation.
5. MQL-to-SQL Conversion Rate
For organizations with defined marketing and sales stages, MQL-to-SQL conversion shows how frequently marketing-qualified leads progress to sales qualification. Those stages require shared definitions. HubSpot’s lifecycle-stage framework distinguishes marketing qualification from sales’ assessment of whether a lead represents a potential customer.
If 20 out of 100 MQLs become SQLs, the conversion rate is 20%.
The same group should be tracked over a reporting period that allows sales enough time to evaluate it. If progression slows, the explanation could involve lead suitability, qualification criteria, follow-up timing or the handoff process.
This is where marketing data benefits from sales context. In the retail marketing system I built for Big Brands, shared campaign timelines and coordination connected marketing activity with sales follow-up. The first tracked direct-mail campaign generated five sales.
6. Trial-to-Paid Conversion Rate
Trial-to-paid conversion rate brings the analysis back to the campaign’s intended business outcome: acquiring paying customers.
It is calculated by dividing trial accounts that become paying customers by trial accounts in the same group and multiplying by 100.
If eight out of 100 trial accounts become paying customers within the defined follow-up period, the conversion rate is 8%.
Healthy trial volume paired with low paid conversion directs attention towards the experience after signup. Product usage could show whether new users reached a meaningful milestone during the trial. Support feedback might reveal setup problems. Cancellation reasons could indicate a gap between the campaign promise and the product experience.
If suitable users consistently stall during setup, an onboarding email helping them complete their first project could be worth testing. I would compare project completion and paid conversion while allowing both groups equal time to finish the trial.
Without product usage or customer feedback, I would treat onboarding as a hypothesis rather than a diagnosis.
7. Return on Ad Spend
Return on ad spend compares advertising spend with the revenue attributed to that advertising.
If $1,000 in advertising receives credit for $4,000 in revenue, the campaign reports a 4x ROAS.
The calculation is straightforward, but its meaning isn’t always clear.
Before treating 4x ROAS as evidence that the campaign deserves more budget, I would confirm what the reported value represents. Google Ads can use assigned conversion values, so the figure may reflect values other than collected revenue.
For a subscription product, I would also distinguish revenue already earned from projected customer value and examine how revenue credit was assigned. ROAS does not include every business cost, and different attribution methods can produce different views of the same campaign.
The number can be correct while the investment decision still requires more context.
Across the full campaign, several results that initially looked conclusive now tell a more nuanced story:
- High CTR may reflect relevant messaging or an overly broad promise.
- Low landing page conversion identifies a drop but does not prove the page caused it.
- Cheap leads may become expensive when qualification is considered.
- Strong signup volume can conceal weak product adoption.
- High ROAS can depend on how revenue and attribution are defined.
Reporting tells us what moved. Marketing judgment determines what the movement means and what should be investigated next.
How to Strengthen Marketing Judgment Without Full Reporting Access
Access to downstream performance data varies across organizations and roles. Even when you don’t control the reporting structure, there are practical ways to connect your work with the evidence and decisions that follow.
Define Success Before the Work Begins
During the briefing, identify the business outcome and how the team plans to evaluate it.
For the software campaign, trial registration is the immediate conversion. Acquiring suitable users who become customers is the larger objective. Understanding that distinction can influence the audience, offer, messaging and onboarding experience before anything launches.
I used the same objective-first approach when rebuilding my portfolio website, working backwards from its purpose, audience, required information, supporting proof and intended action before making decisions about content, SEO or UX.
Get Context From Downstream Teams
A headline result such as “the campaign performed well” provides limited information that can be applied to future work.
Ask which results changed, what the team believes contributed to them and what should influence the next campaign. A focused performance summary may provide enough context without requiring access to every platform.
Sales conversations, product usage, support questions and cancellation reasons can also reveal whether the campaign attracted suitable prospects and set accurate expectations.
Follow One Decision Through to Its Result
Identify one meaningful change, why the team is making it and which result should respond. Agree on when that result will be reviewed.
If several variables change simultaneously, be careful about attributing the outcome to a single decision. Recognizing what cannot be concluded is part of sound analysis.
Following one decision from hypothesis to outcome creates a more useful learning loop than reviewing a dashboard without knowing what changed or why.
Pair Training With Practical Analysis
Courses can provide structure, terminology and platform familiarity. Google Skillshop offers training created by Google product experts, while Google’s Analytics demo account provides access to real business data from the Google Merchandise Store and Flood-It! properties.
That creates an opportunity to practise with a business question rather than clicking through reports without a purpose.
Choose a question like:
Which traffic sources bring users who eventually purchase?
Find the relevant information, explain what the data shows and separate that observation from your theory about why it happened. Then identify what additional information would strengthen the analysis.
MeasureSchool and Loves Data also provide guided GA4 tutorials. The useful step is applying the workflow to a new question after completing the walkthrough.
Certification demonstrates familiarity with various platforms, but practical analysis develops the ability to explain what a result means, what remains uncertain and what should be investigated next.
Make Better Marketing Decisions Without Owning the Dashboard
Dashboard ownership provides access to the data, but marketing judgment gives that data direction.
On your next campaign, advocate for one follow-up conversation after the handoff. Choose a metric, ask what happened at the next stage and bring that evidence into the next decision.
One well-directed follow-up can turn a partial result into useful insight for the campaign that follows.
If your team is looking for someone who connects execution with the evidence behind it, I’d love to chat. Contact me, or follow me on LinkedIn for more of this kind of thinking.